In this post lets learn how to debug Blazor apps. This post is the second one in the Blazor series. Check out my previous post for getting started with Blazor. We will be using VS Code to Debug the Blazor server and Blazor wasm app.
Debugging Blazor Server App
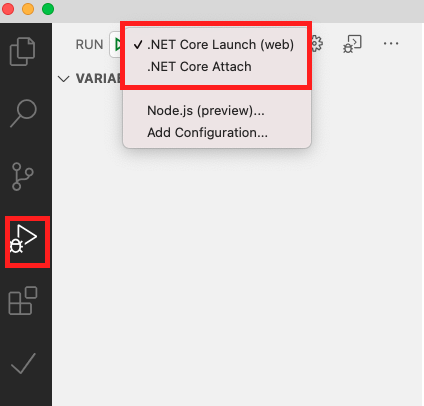
Debugging Blazor server app is very straightforward and similar to debugging any other ASP.NET Core app. Open the Debug menu and then click on .NET Core Launch (web) option.
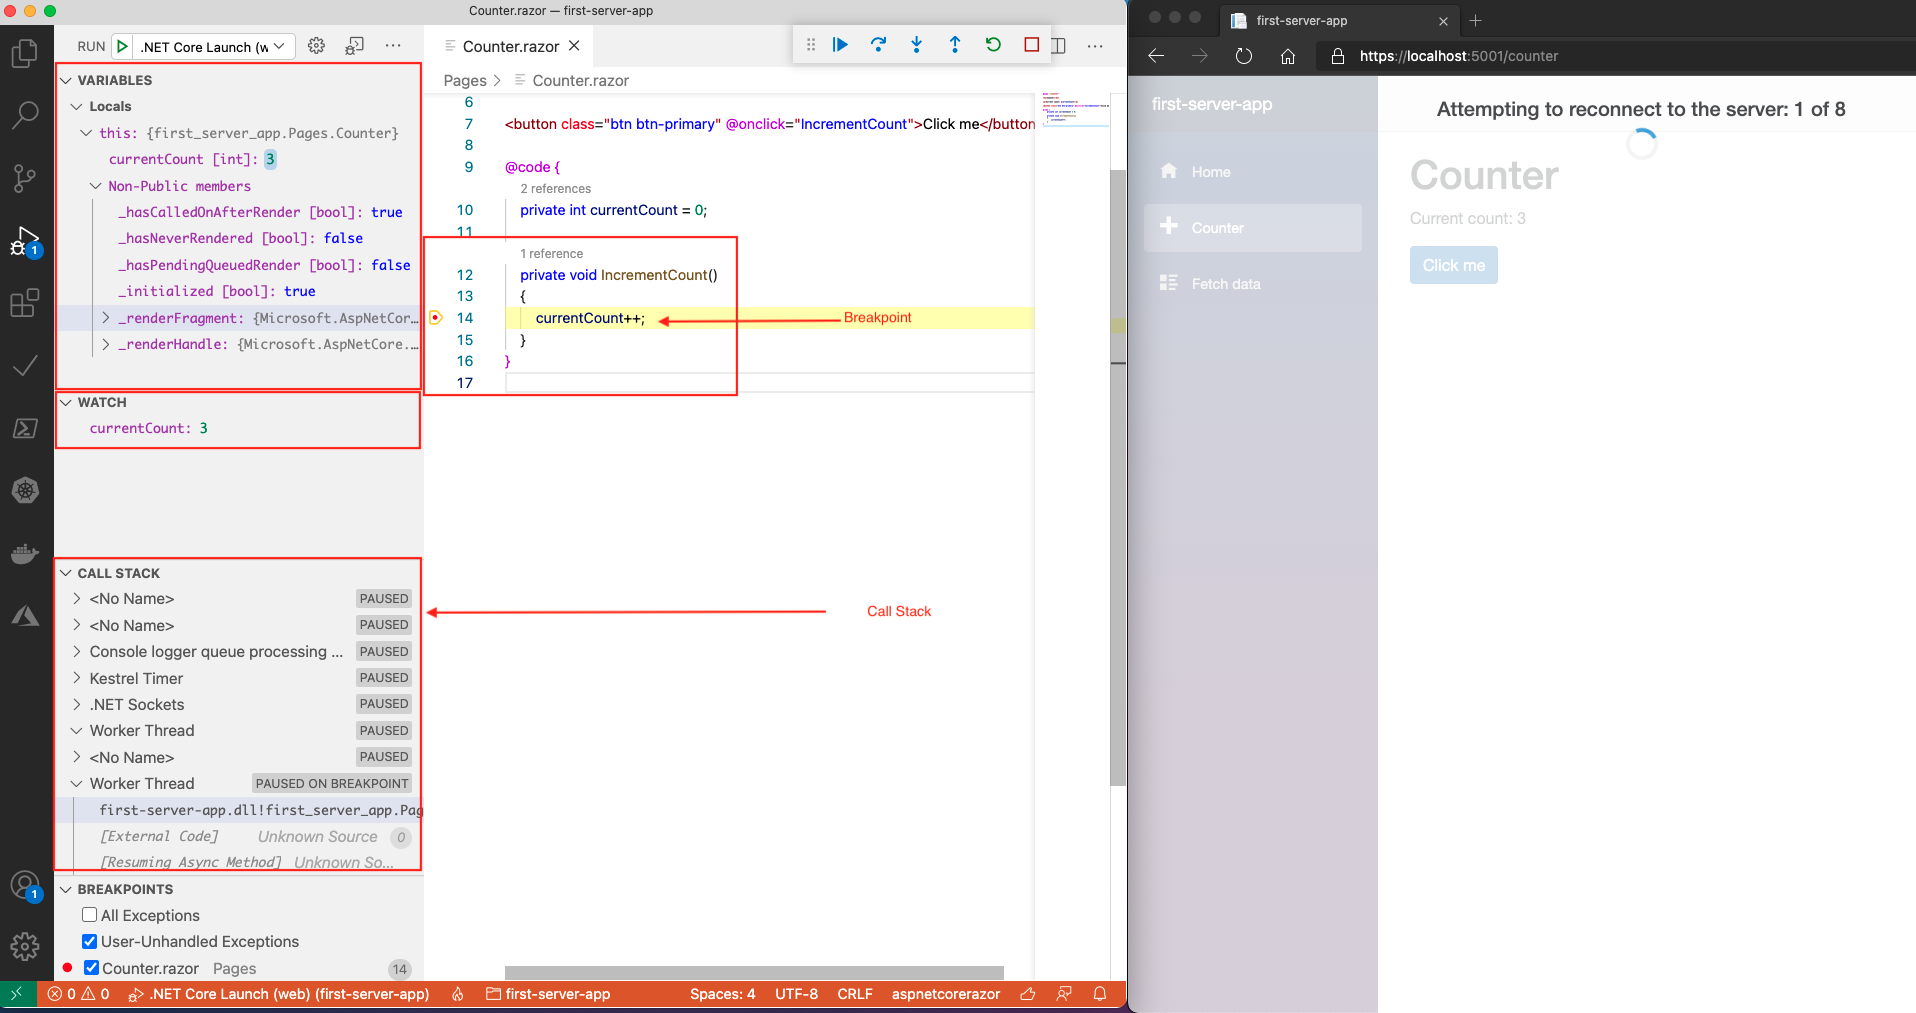
Clicking on the Green Play icon will launch a new browser automatically and run the blazor application in it and attach the VS Debugger to it. Post that any action performed in the browser would automatically stop at the breakpoints. As you can see in the below screen shot, I had kept a breakpoint in the IncrementCount function within Counter.razor file and then clicking on the Click me button in the browser would hit the breakpoint and all the variables and call stack could be viewed within VS Code Debug window.
If in case, you would like to understand how this works, open the launch.json under .vscode folder in the root directory of your app’s folder and check the below snippet.
 {
            "name": ".NET Core Launch (web)",
            "type": "coreclr",
            "request": "launch",
            "preLaunchTask": "build",
            // If you have changed target frameworks, make sure to update the program path.
            "program": "${workspaceFolder}/bin/Debug/net5.0/first-server-app.dll",
            "args": [],
            "cwd": "${workspaceFolder}",
            "stopAtEntry": false,
            // Enable launching a web browser when ASP.NET Core starts. For more information: https://aka.ms/VSCode-CS-LaunchJson-WebBrowser
            "serverReadyAction": {
                "action": "openExternally",
                "pattern": "\\bNow listening on:\\s+(https?://\\S+)"
            },
            "env": {
                "ASPNETCORE_ENVIRONMENT": "Development"
            },
            "sourceFileMap": {
                "/Views": "${workspaceFolder}/Views"
            }
        },
The highlighted line is the one responsible for launching the browser automatically and loading the application into it.
Debugging Blazor Webassembly App
Debugging blazor web assembly is NOT as straightforward as debugging blazor server apps as the blazor webassembly apps are run entirely in the browser context and attaching the debugger to it needs additional settings to be taken care. But, this is also taken care in VS Code. Clicking on the Debug menu in VS Code would show a screen as shown below in the screenshot
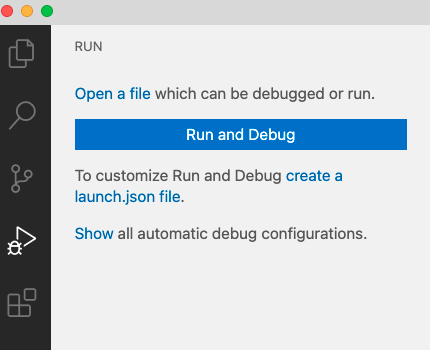
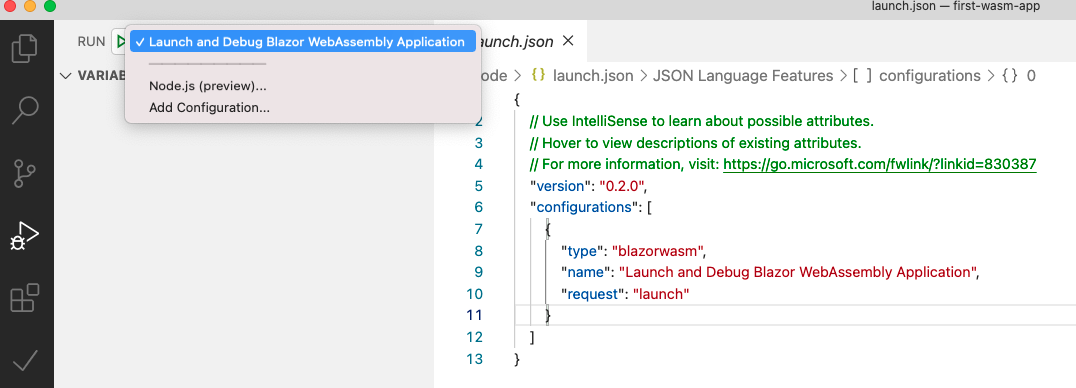
This is because, there is no launch.json file present within the project space. To create one, click on the create a launch.json file link. This will automatically create the launch.json with the right settings as shown below:
Click on the Green Play icon. This should open up CHROME browser (it always launch Chrome at the time of this writing, though I have set Edge (Chromium) as default browser in my machine) and load the app into it, and attach the VS Debugger as well. This is a new feature addition as a part of .NET 5 release. Post this, you could put breakpoints anywhere in the component and browser actions would stop at the break point in VS Code.
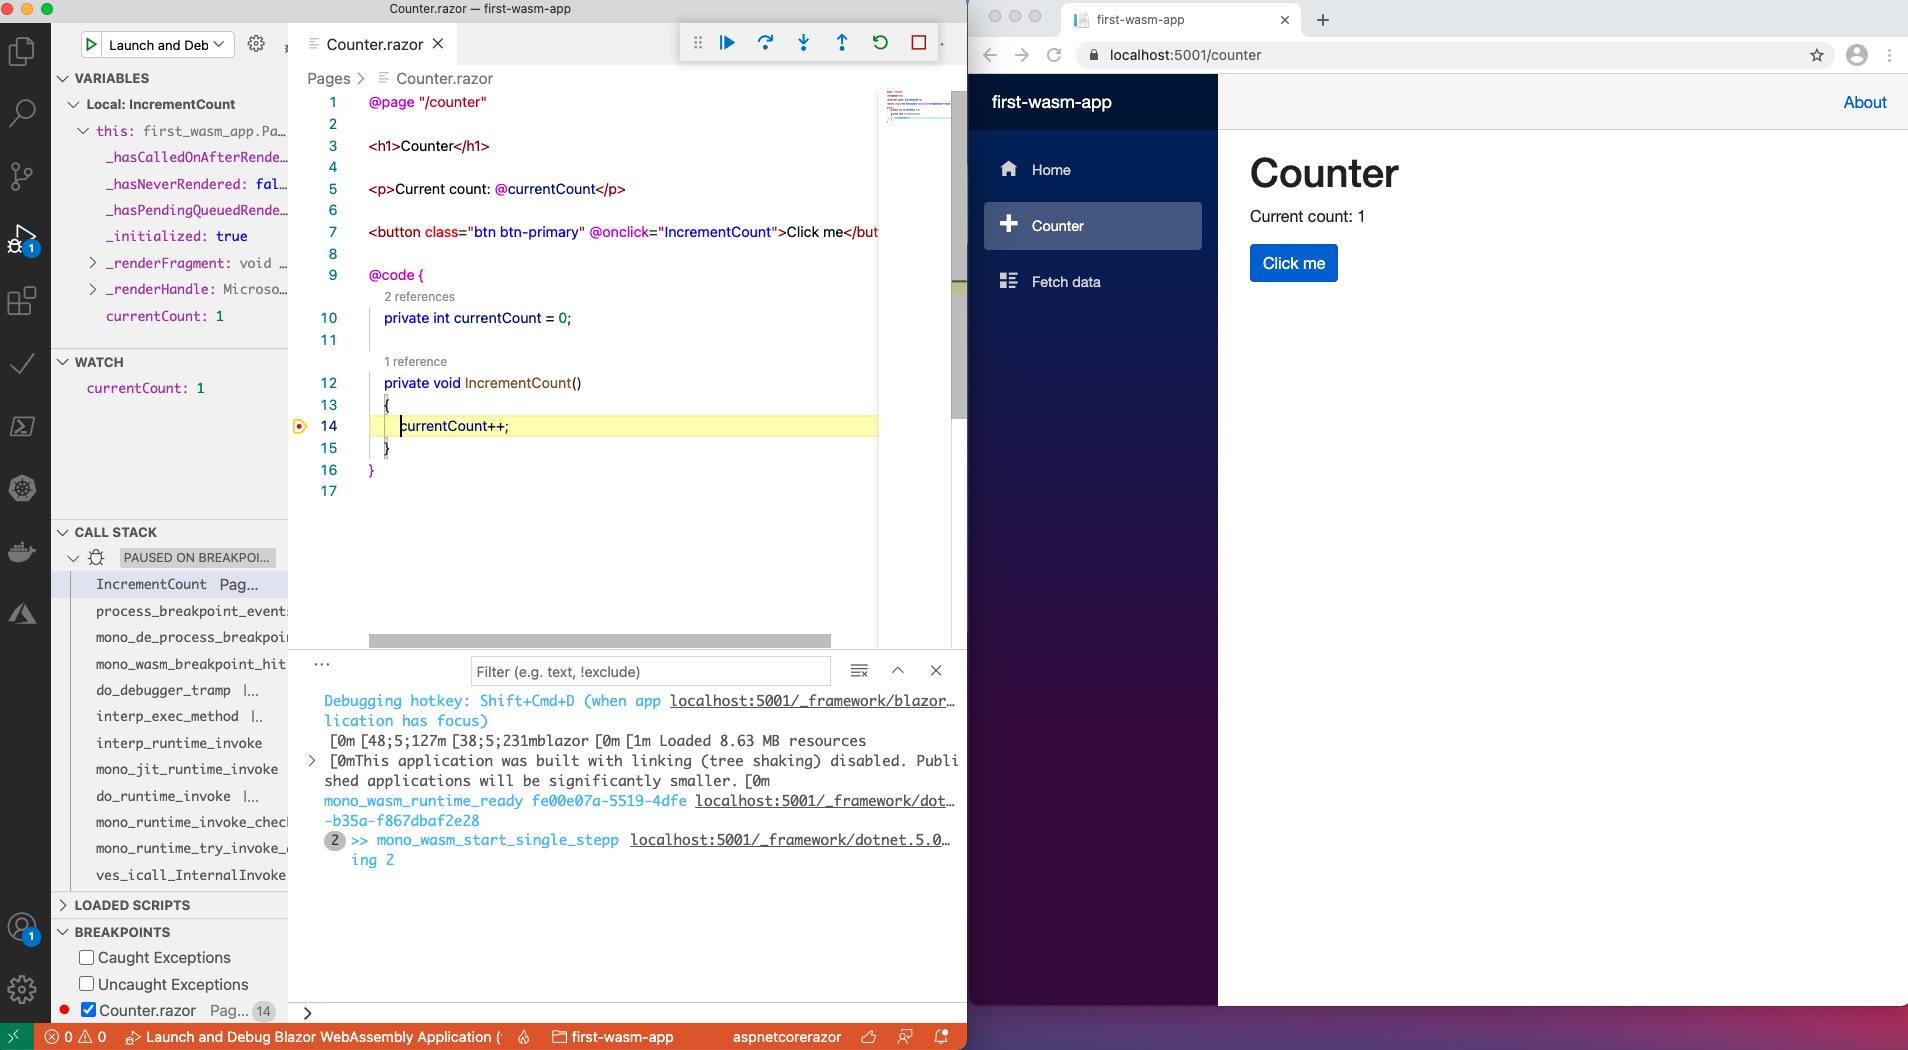
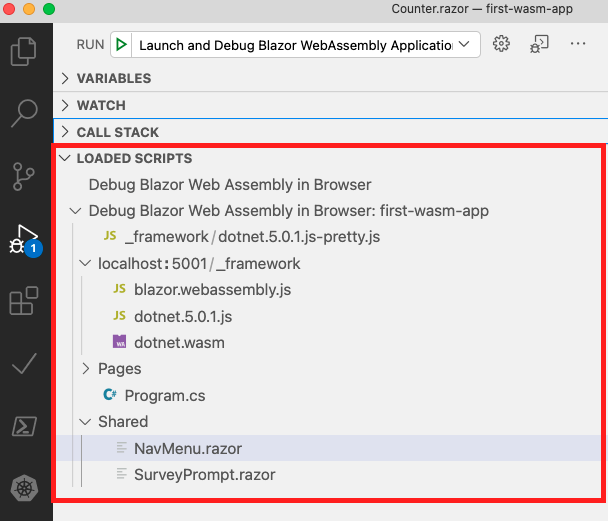
One of the important things to note is the Loaded Scripts pane within the Debug window. This is similar to the Sources tab within Chrome Developer Console. All the loaded JS scripts and the C# code of the shared razor components are all shown here.
The VS Code Debugging bit is a little flimsy at this point. When you start subsequent debugging sessions, you might encounter an error like this from VS Code Debugger extension, though you close the previous debugging session by clicking the stop button.

If you happen to see this, just click on Debug Anyway and that should help in proceeding further with application debugging.
That’s it! Its that simple to debug the blazor apps in VS Code. Tooling and Debugging play a vital role in keeping any developer productive and blazor tools and debugging experience is getting there with every major release 🙂
