I have been working on a large scale angular 1.x based application which has humongous number of unit tests written using Jasmine framework and executed using Karma runner. Of late, as the project grew bigger, it became a little trickier to write/maintain the right unit tests. But with the right code editor/IDE, we don’t have to worry about that fact. In this blog post, I will be walking you through how we can leverage the debugging capabilities of Visual Studio Code to debug the jasmine unit tests. In case, you have not heard of it, or not been using VS Code for your day-to-day development work, I highly recommend you download the latest version available now and get yourself started. For the demonstration purposes, I will be using a sample app created using Yeoman angular generator. In case, you already have an existing project with karma setup running, you can directly head to Step 3
Step 1 : Create the angular app
Yeoman is a great scaffolding tool that works on the concept of generators. Yeoman is distributed as npm package. To scaffold a new angular application. Install yeoman and generator-angular modules. Run the below commands
npm install -g yo
npm install -g generator-angular
Once the angular generator is installed, you can simply run the command yo angular to scaffold a new angular application. Once the app is scaffolded, yeoman will automatically pull down the node modules and bower components. To make sure the tests are running, simply run the command grunt test.
This should run two tests and provide the below output:
... <Trimmed the other task outputs>
Running "karma:unit" (karma) task
07 04 2017 17:17:54.728:WARN [watcher]: Pattern "/Users/z066157/SampleProjects/YeomanSamples/ng-test/test/mock/**/*.js" does not match any file.
07 04 2017 17:17:54.744:WARN [karma]: Port 8080 in use
07 04 2017 17:17:54.744:INFO [karma]: Karma v1.6.0 server started at http://0.0.0.0:8081/
07 04 2017 17:17:54.745:INFO [launcher]: Launching browser PhantomJS with unlimited concurrency
07 04 2017 17:17:54.750:INFO [launcher]: Starting browser PhantomJS
07 04 2017 17:17:57.503:INFO [PhantomJS 2.1.1 (Mac OS X 0.0.0)]: Connected on socket 84AgTMXhYS9wn_rpAAAA with id 67814620
PhantomJS 2.1.1 (Mac OS X 0.0.0): Executed 2 of 2 SUCCESS(0.002 secs / 0.009 secs)
Done, without errors.
Step 2 : Setting up the karma.conf.js for running tests in Chrome browser
Karma relies completely on the karma.conf.js config file. By default, karma uses Phantomjs – a headless browser to run the unit tests. For debugging purposes, let’s use Chrome as the browser. Locate the browsers section in your karma.conf.js file and add Chrome to it.
browsers: [
'PhantomJS',
'Chrome'
],
To launch Chrome from karma, we need to use karma-chrome-launcher. Run the command npm install karma-chrome-launcher --save to install to the application. Add the karma-chrome-launcher plugin to the plugins list in your karma.conf.js file.
plugins: [
'karma-phantomjs-launcher',
'karma-jasmine',
'karma-chrome-launcher'
],
To make sure the tests are running fine, you can run the command karma start karma.conf.js --browsers Chrome The output should look like below :
$ karma start test/karma.conf.js --browsers Chrome
07 04 2017 18:09:23.018:WARN [watcher]: Pattern "/Users/z066157/SampleProjects/YeomanSamples/ng-test/test/mock/**/*.js" does not match any file.
07 04 2017 18:09:23.036:WARN [karma]: No captured browser, open http://localhost:8080/
07 04 2017 18:09:23.046:WARN [karma]: Port 8080 in use
07 04 2017 18:09:23.046:INFO [karma]: Karma v1.6.0 server started at http://0.0.0.0:8081/
07 04 2017 18:09:23.046:INFO [launcher]: Launching browser Chrome with unlimited concurrency
07 04 2017 18:09:23.077:INFO [launcher]: Starting browser Chrome
07 04 2017 18:09:24.500:INFO [Chrome 57.0.2987 (Mac OS X 10.11.6)]: Connected on socket INWSvnmz-Y_UvIZJAAAA with id 84227671
Chrome 57.0.2987 (Mac OS X 10.11.6): Executed 2 of 2SUCCESS (0.025 secs / 0.019 secs)
Step 3 : Setting up Karma.conf.js for Chrome debugging
Now that the tests are running fine in chrome browser as well, let’s go ahead and modify the karma.conf.js file further to enable Chrome debugging. Karma offers a nice way to create customLaunchers – i.e, we can pass custom arguments, To enable Chrome debugging, all we need is the below set of lines in the config file. Set the port in which chrome needs to attach the debugger to and debug property to true
customLaunchers: {
Chrome_with_debugging: {
base: 'Chrome',
flags: ['--remote-debugging-port=9222'],
debug: true
}
}
To run the tests with this custom launcher, we just need to tweak our test execution statement.
karma start test/karma.conf.js --browsers Chrome_with_debugging
The results should be exactly the same as in step 2. That’s all required from karma configuration perspective.
Step 4 : Setting up VS Code With Chrome Debugger
VS Code has the inherent ability to debug node.js applications. However, to debug applications running within Chrome browser, we need to install extension. VS Code offers a great extensibility model which allows developers to create custom extensions. The extensions can be downloaded from Visual Studio marketplace. For this specific scenario, we need to download Debugger For Chrome extension. Below image shows how to install extension in VS Code.
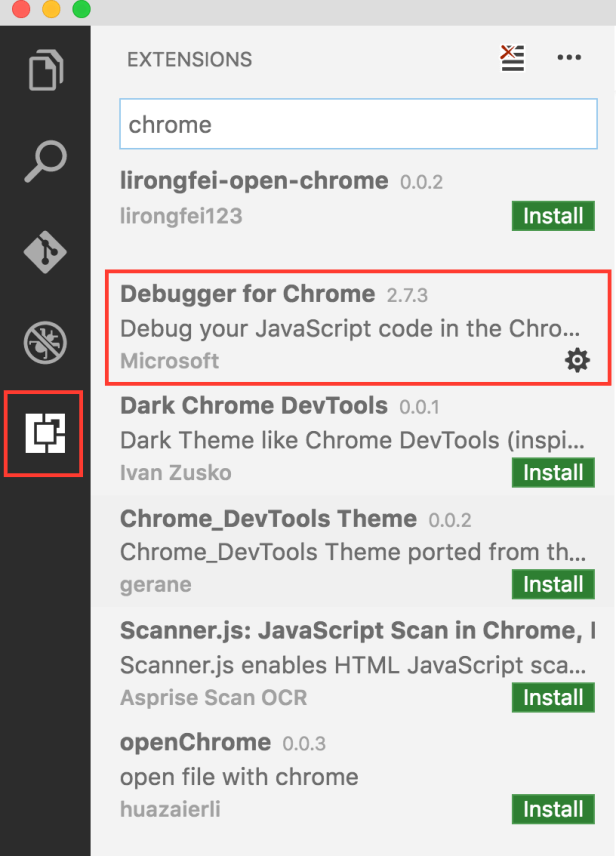
Since I had installed the extension already, Install button is not available
Step 5 : Enabling Chrome debugging for unit tests in the application
Click on the Debug icon on the left navigation menu in VS Code, and then click on the tiny gear icon, to toggle a new launch configuration. In the list populated select Chrome

VS Code should automatically create a launch.json which it uses internally to manage the application launch configurations. You should see 2 different JSON objects one for launching the app and the other for attaching the app. Since in this case, we are going to attach the debugger to already running karma process, let’s go ahead and modify the attach configuration. The final configuration should look like the below one:
{
"name": "Debug tests in Chrome",
"type": "chrome",
"request": "attach",
"port": 9222,
"sourceMaps": true,
"webRoot": "${workspaceRoot}"
}
You can either retain the other configuration with "request" : "launch" or can remove it, as that’s not relevant for this specific scenario.
To see the actual debugging in action, Click on Debug icon, and then select the Debug tests in Chrome configuration and click on the little green play button. VS Code should be able to attach the debugger to the Chrome instance launched by karma runner.

Make changes to the test method you want to debug, add a breakpoint wherever required, and save the file. Karma watcher should automatically pick up the changes, run the unit tests. When the unit test with the breakpoint addded is getting executed, VS Code will automatically pause. Now, you can check all the local variables, add variables to watch, view the call stack and you can step in, step out or step over any methods and enjoy full debugging of your unit tests too. Below video shows the debugger in action.


Excellent post Swaminathan…very helpful and detailed! Thank you.
Thank you! I am glad you found it useful.
I find debugging unit tests in Visual Studio Code to be very helpful.